Scientific Products
Data Explorer by Atomistica
Registered users with activated accounts can access Data Explorer by Atomistica using the button below.
New to Data Explorer by Atomistica? Learn how to create an account on our Registration Information page, or sign up directly through the Registration Portal.
Data Explorer by Atomistica
Interactive Web Platform for Statistical Data Analysis
Data Explorer is a comprehensive, browser-based platform for statistical analysis, data preprocessing, and exploratory data analysis, developed by Atomistica. It provides an accessible collection of tools for processing datasets, performing statistical calculations, identifying relationships between variables, and applying multivariate analysis methods.
Designed for researchers, students, educators, and professionals working with scientific data, Data Explorer simplifies statistical workflows through an intuitive graphical interface, eliminating the need for software installation or programming experience.
Data Explorer is freely available for academic research and educational purposes. Commercial use is subject to separate licensing terms and conditions. Organizations and individuals interested in commercial applications are encouraged to contact Atomistica for further information.
Citation of relevant scientific publications is mandatory when using Data Explorer in research leading to scientific publications. Users are required to acknowledge the software and cite the appropriate references, as described on our dedicated How to Cite page.
Overview of Data Explorer Capabilities
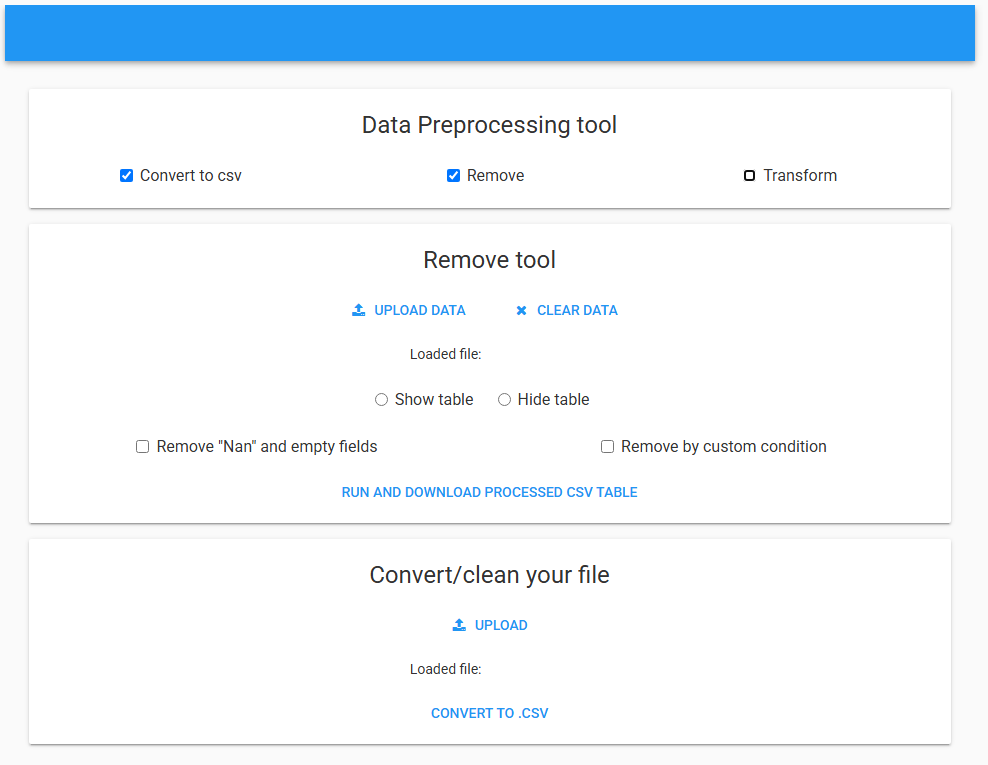
Data Preprocessing and Transformation
Prepare and organize datasets for statistical analysis using accessible data processing tools:
- CSV Conversion – Convert and prepare datasets in CSV format for further processing and analysis.
- Data Cleaning – Identify and remove missing values, empty fields, and unwanted data entries.
- Custom Data Filtering – Remove observations based on user-defined conditions.
- Data Transformation – Apply mathematical transformations to selected variables.
Data Preview and Export – Inspect uploaded datasets and download processed data for further use.
Descriptive Statistics and Data Distribution
Explore fundamental statistical properties and understand the distribution of numerical data:
- Normal Distribution Analysis – Examine the distribution of selected variables using histograms with configurable bin numbers.
- Standard Deviation Calculator – Calculate standard deviations for individual variables or multiple dataset columns.
- Mean Value Calculation – Determine arithmetic mean values alongside standard deviations.
- Statistical Data Export – Download calculated statistical parameters for further analysis and reporting.
Correlation Analysis
Investigate statistical relationships between variables:
- Correlation Coefficients – Calculate correlation coefficients between selected numerical variables.
- Variable Selection – Select variables directly from uploaded datasets for correlation analysis.
- Results Export – Download correlation analysis results for further interpretation and documentation.
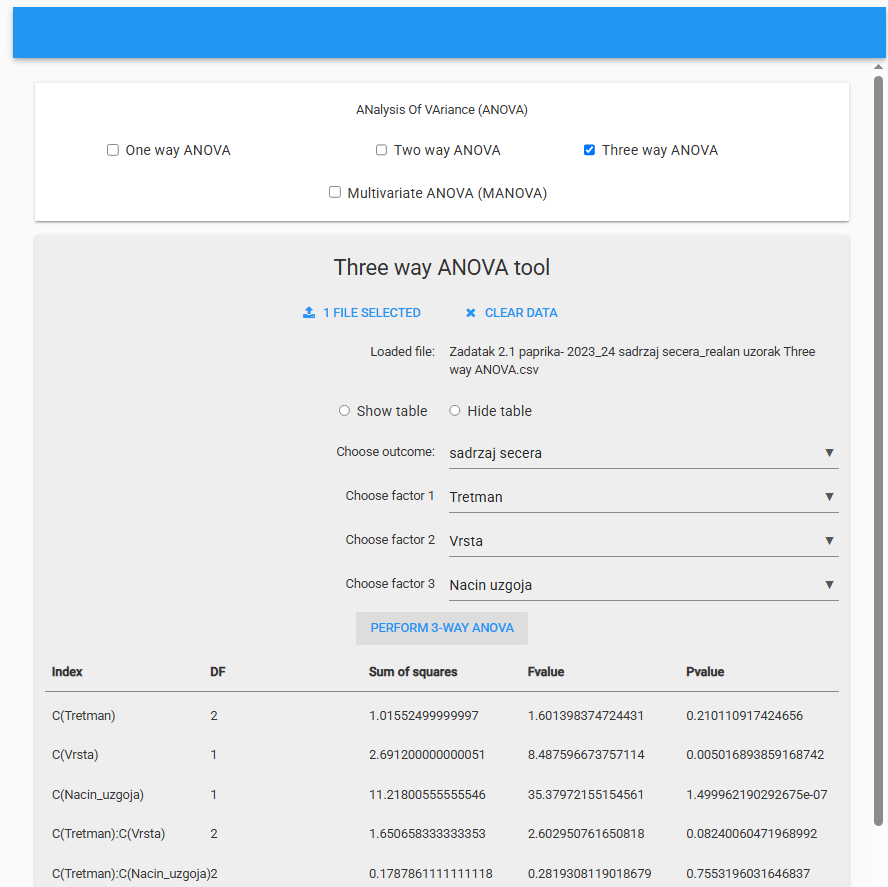
Analysis of Variance (ANOVA)
Evaluate differences between groups and investigate the statistical significance of experimental factors:
- One-Way ANOVA – Compare group means based on a single categorical factor.
- Two-Way ANOVA – Investigate the effects of two factors on a numerical response variable.
- Three-Way ANOVA – Examine the influence of three experimental factors.
- Multivariate Analysis of Variance (MANOVA) – Perform multivariate comparisons involving multiple dependent variables.
- Statistical Results – Obtain relevant statistical parameters, including F-statistics, degrees of freedom, and p-values, where applicable.
These tools are particularly useful for experimental research, comparative studies, and the evaluation of factor effects.
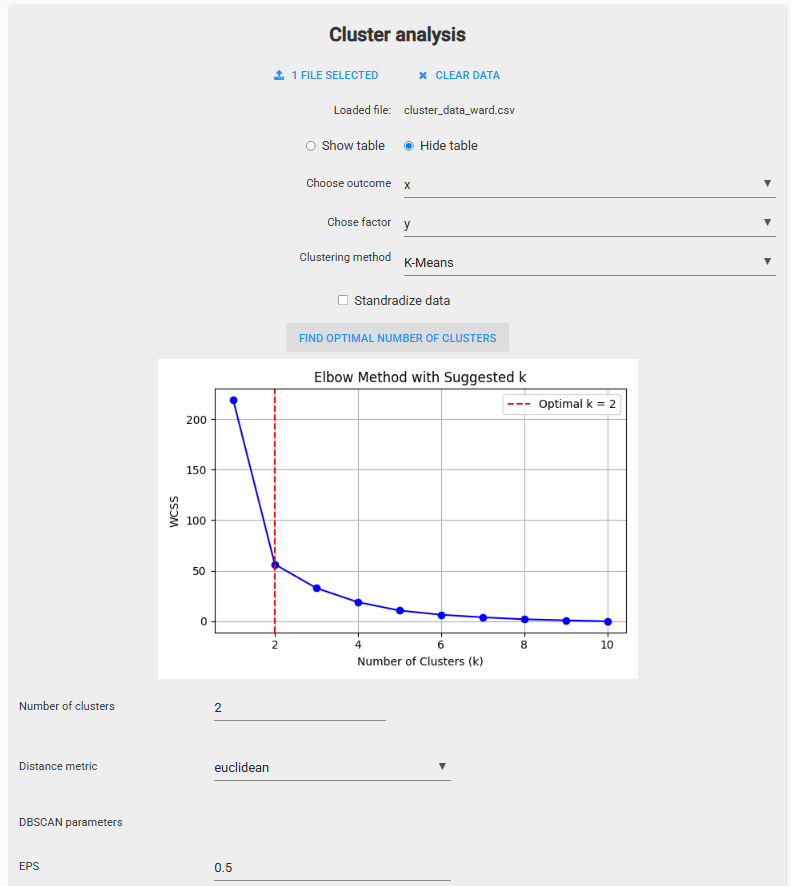
Cluster Analysis
Discover patterns and identify groups of similar observations within multidimensional datasets:
- K-Means Clustering – Partition observations into clusters based on similarities between data points.
- DBSCAN Clustering – Identify density-based clusters and distinguish potentially isolated observations.
- Cluster Optimization – Explore the optimal number of clusters for selected datasets.
- Data Standardization – Optionally standardize numerical variables before clustering.
- Distance Metrics – Configure distance measures and clustering parameters.
Cluster analysis provides valuable insights into hidden data structures and relationships between observations.
Principal Component Analysis (PCA)
Reduce dataset dimensionality and explore relationships between multiple numerical variables:
- Principal Component Analysis – Transform multidimensional datasets into a reduced set of principal components.
- Explained Variance Analysis – Calculate the percentage of variance explained by principal components.
- Two-Dimensional PCA Visualization – Generate graphical representations of observations in principal component space.
- Customizable Visualizations – Adjust principal component selection, point labels, and legend placement.
- Results and Figure Export – Download explained variance results and PCA figures in PNG format.
PCA is particularly useful for exploratory analysis, dimensionality reduction, and the visualization of complex scientific datasets.
Statistical Hypothesis Testing
Evaluate statistical assumptions, compare datasets, and assess the significance of observed differences:
- F-Test – Compare variances between two datasets.
- Kruskal–Wallis Test – Perform nonparametric comparisons between independent groups.
- Tukey’s Honestly Significant Difference (HSD) Test – Conduct post-hoc comparisons between group means.
- Shapiro–Wilk Test – Assess whether numerical data are consistent with a normal distribution.
- Levene’s Test – Evaluate the homogeneity of variances across groups.
These tests support statistical decision-making and the interpretation of experimental results.
Why Choose Data Explorer?
- No Installation Required – Access statistical analysis tools directly from your web browser.
- No Programming Experience Needed – Perform statistical calculations using an intuitive graphical interface.
- Comprehensive Statistical Toolkit – Combine data preprocessing, descriptive statistics, hypothesis testing, and multivariate analysis within a single platform.
- Data Import and Export – Upload datasets and download processed data, statistical results, and supported visualizations.
- Free for Academic Research and Education – Accessible tools supporting scientific research, university teaching, and student learning.
- Integrated Scientific Ecosystem – Part of the Atomistica Explorer Suite, alongside tools for atomistic modeling, machine learning, and scientific programming.
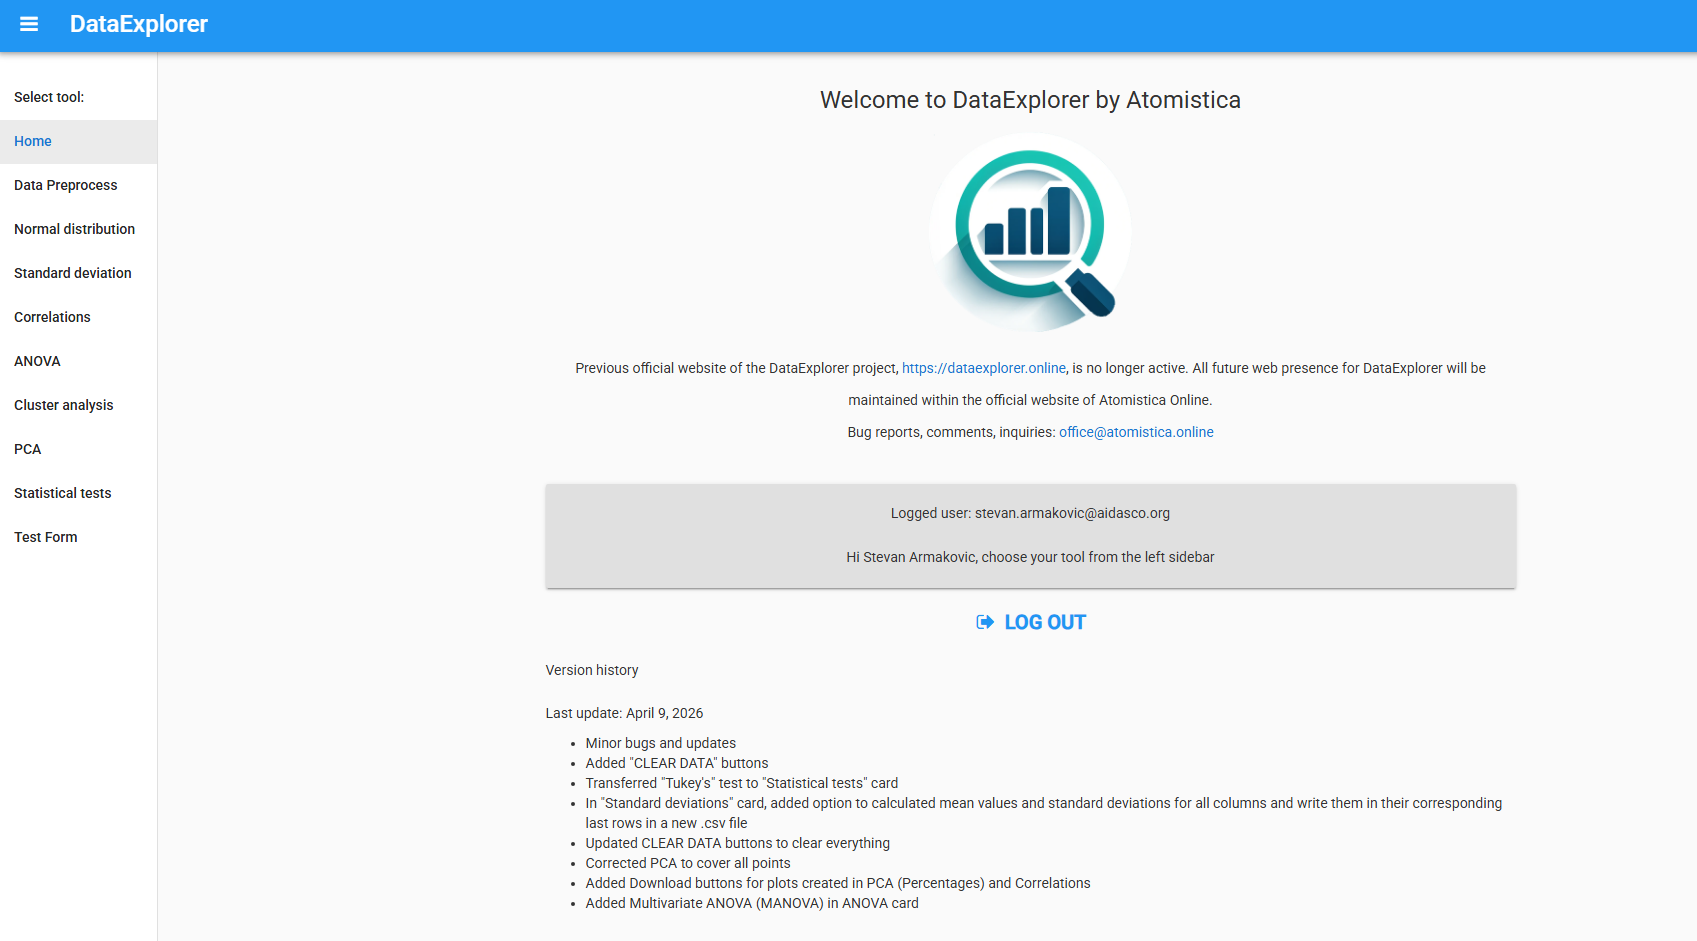
Screenshots from Data Explorer by Atomistica